Duration: (11:45) ?Subscribe5835 2025-02-22T20:37:12+00:00
Python数据分析超级简光速入门—Matplotlib绘制箱型图和散点图
(11:45)
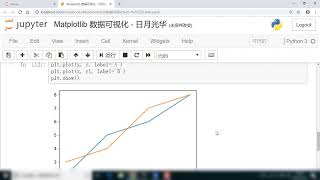
Python数据分析超级简光速入门——Matplotlib绘制线型图
(13:41)
Python数据分析超级简光速入门——Matplotlib绘图库简介
(12:53)
Python数据分析超级简光速入门—Matplotlib设置刻度与样式
(15:19)
Python数据分析超级简光速入门—Matplotlib设置线形、属性及标签
(12:21)
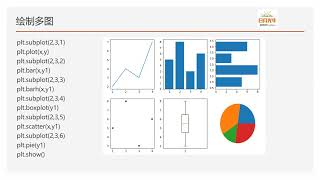
箱形图Box,饼图Pie【Matplotlib入门教程9】
(9:8)
折线图(Line),散点图(Scatter)【Matplotlib入门教程6】
(6:21)
Python数据可视化分析-matplotlib-3.散点图
(12:17)
Mastering Matplotlib: Data Visualization with Python
(51:19)
【python】4小時初學者Python教學 #python #python教學 #python入門
(4:4:36)
Is Plotly The Better Matplotlib?
(22:58)
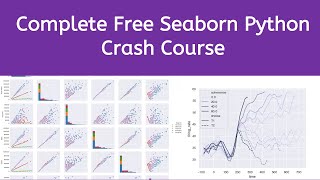
Seaborn Python Tutorial | Complete Seaborn Crash Course | Data Visualization in Seaborn | Kgp Talkie
(2:52:19)
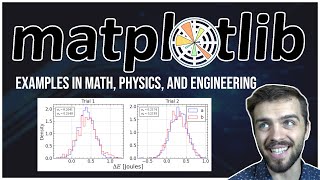
Matplotlib Tutorial: For Physicists, Engineers, and Mathematicians
(48:)
推薦!!Python 資料視覺化的工具(上集):matplotlib、pandas、seaborn #補根知識 011
(11:6)
Data visualization with python | Create and customize plots using Matplotlib, seaborn and pandas
(43:52)
2.3 如何利用Excel 2010 繪製盒鬚圖(計算五數綜合) (99學年度版本)-1
(12:2)
Matplotlib Animations in Python
(12:22)
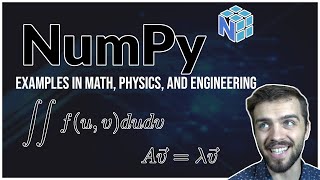
NumPy Tutorial: For Physicists, Engineers, and Mathematicians
(1:32:42)
【Matplotlib基础|索哥Python科学绘图教程03】绘制第一张Matplotlib图片——线图
(9:3)
用boxplot 箱型图反映数据识别异常值 Python统计09——Python程序设计系列 112
(12:25)
30分钟学习python和matplotlib #python #matplotlib
(21:8)
seaborn 多类别散点图scatterplot\u0026箱线图boxplot\u0026条形图barplot
(11:13)
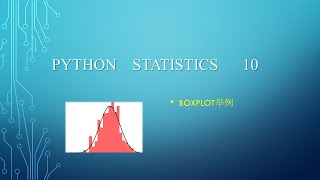
用boxplot绘制箱型图的详细参数 Python统计10——Python程序设计系列 113
(22:46)
Python线图点图--15分钟详解matplotlib.pyplot.plot #11 Everything about line and scatter plots in Python
(15:57)
Plot Points on Graph using matplotlib in Python! #shorts #programming #coding
(17)
Matplotlib Tutorial #9: Subplots
(9:24)